Climate 101: Understanding the numbers
Net zero by 2050. A 55% cut from 1990 levels. 1 GtCO₂e by 2055. A lot of numbers—but what do they actually mean? This article unpacks these values and their implications.

This is a series of #Climate101 write-ups: short, digestible snippets of information intended to help build general knowledge in climate.
TL;DR: Net zero by 2050, gigatonnes, percentage reduction off of 1990 values—these are all tools to help us chart a path towards a sustainable future. But what do these values mean? Are we on track? And how much impact does each new policy really have?
This writeup deep-dives into a few specific policies and compares them against our global emissions trajectors.
Setting our baseline
How much do we emit globally today?
In 2024, total global emissions were ~58 GtCO2e (gigatonnes of carbon dioxide equivalent) according to the Global Carbon Budget.
Here's your first curveball: "global emissions" isn't always defined the same way. Global emissions generally fall into three categories:
- CO2 Emissions from fossil fuels = ~38 Gt
- Non-CO2 gases (e.g., methane, nitrous oxide) converted to GtCO2e = ~14 GtCo2e
- CO2 Emissions from Land Use, Land Use Change and Forestry (commonly referred to in its acronym form LULUCF) = ~6 Gt
Some sources exclude LULUCF due to uncertainty in calculations or to focus on more 'controllable' human-driven activities. The largest LULUCF source is deforestation–when forests are cleared for agriculture, the carbon stored in trees is released as CO2 through burning or decay. Notably, as extreme wildfires become more common, this is another major risk factor of increasing emissions sources.
For this thought exercise, we'll use the full ~58 GtCO2e as our baseline.
What is a"gigatonne" ?
Quick refresher on the units:
- Tonne (t) = a metric tonne equals 1,000 kg
- Megatonne (Mt) = 1 million tonnes
- Gigatonne (Gt) = 1 billion tonnes = 1,000 Mt
We know the baseline. What's the target?
The 2015 Paris Agreement set the goal: net zero by 2050 to limit global warming to 1.5°C above pre-industrial levels by the year 2100.
That means balancing all GHG emissions—CO₂ from fossil fuels, LULUCF, and non-CO₂ gases—with removals by sinks, aiming for zero net emissions by 2050. So if today's emissions are ~58 GtCO2e, the goal is to reduce all of this over the next 25 years. That's roughly 2.2 GtCO2e per year.
Reality Check
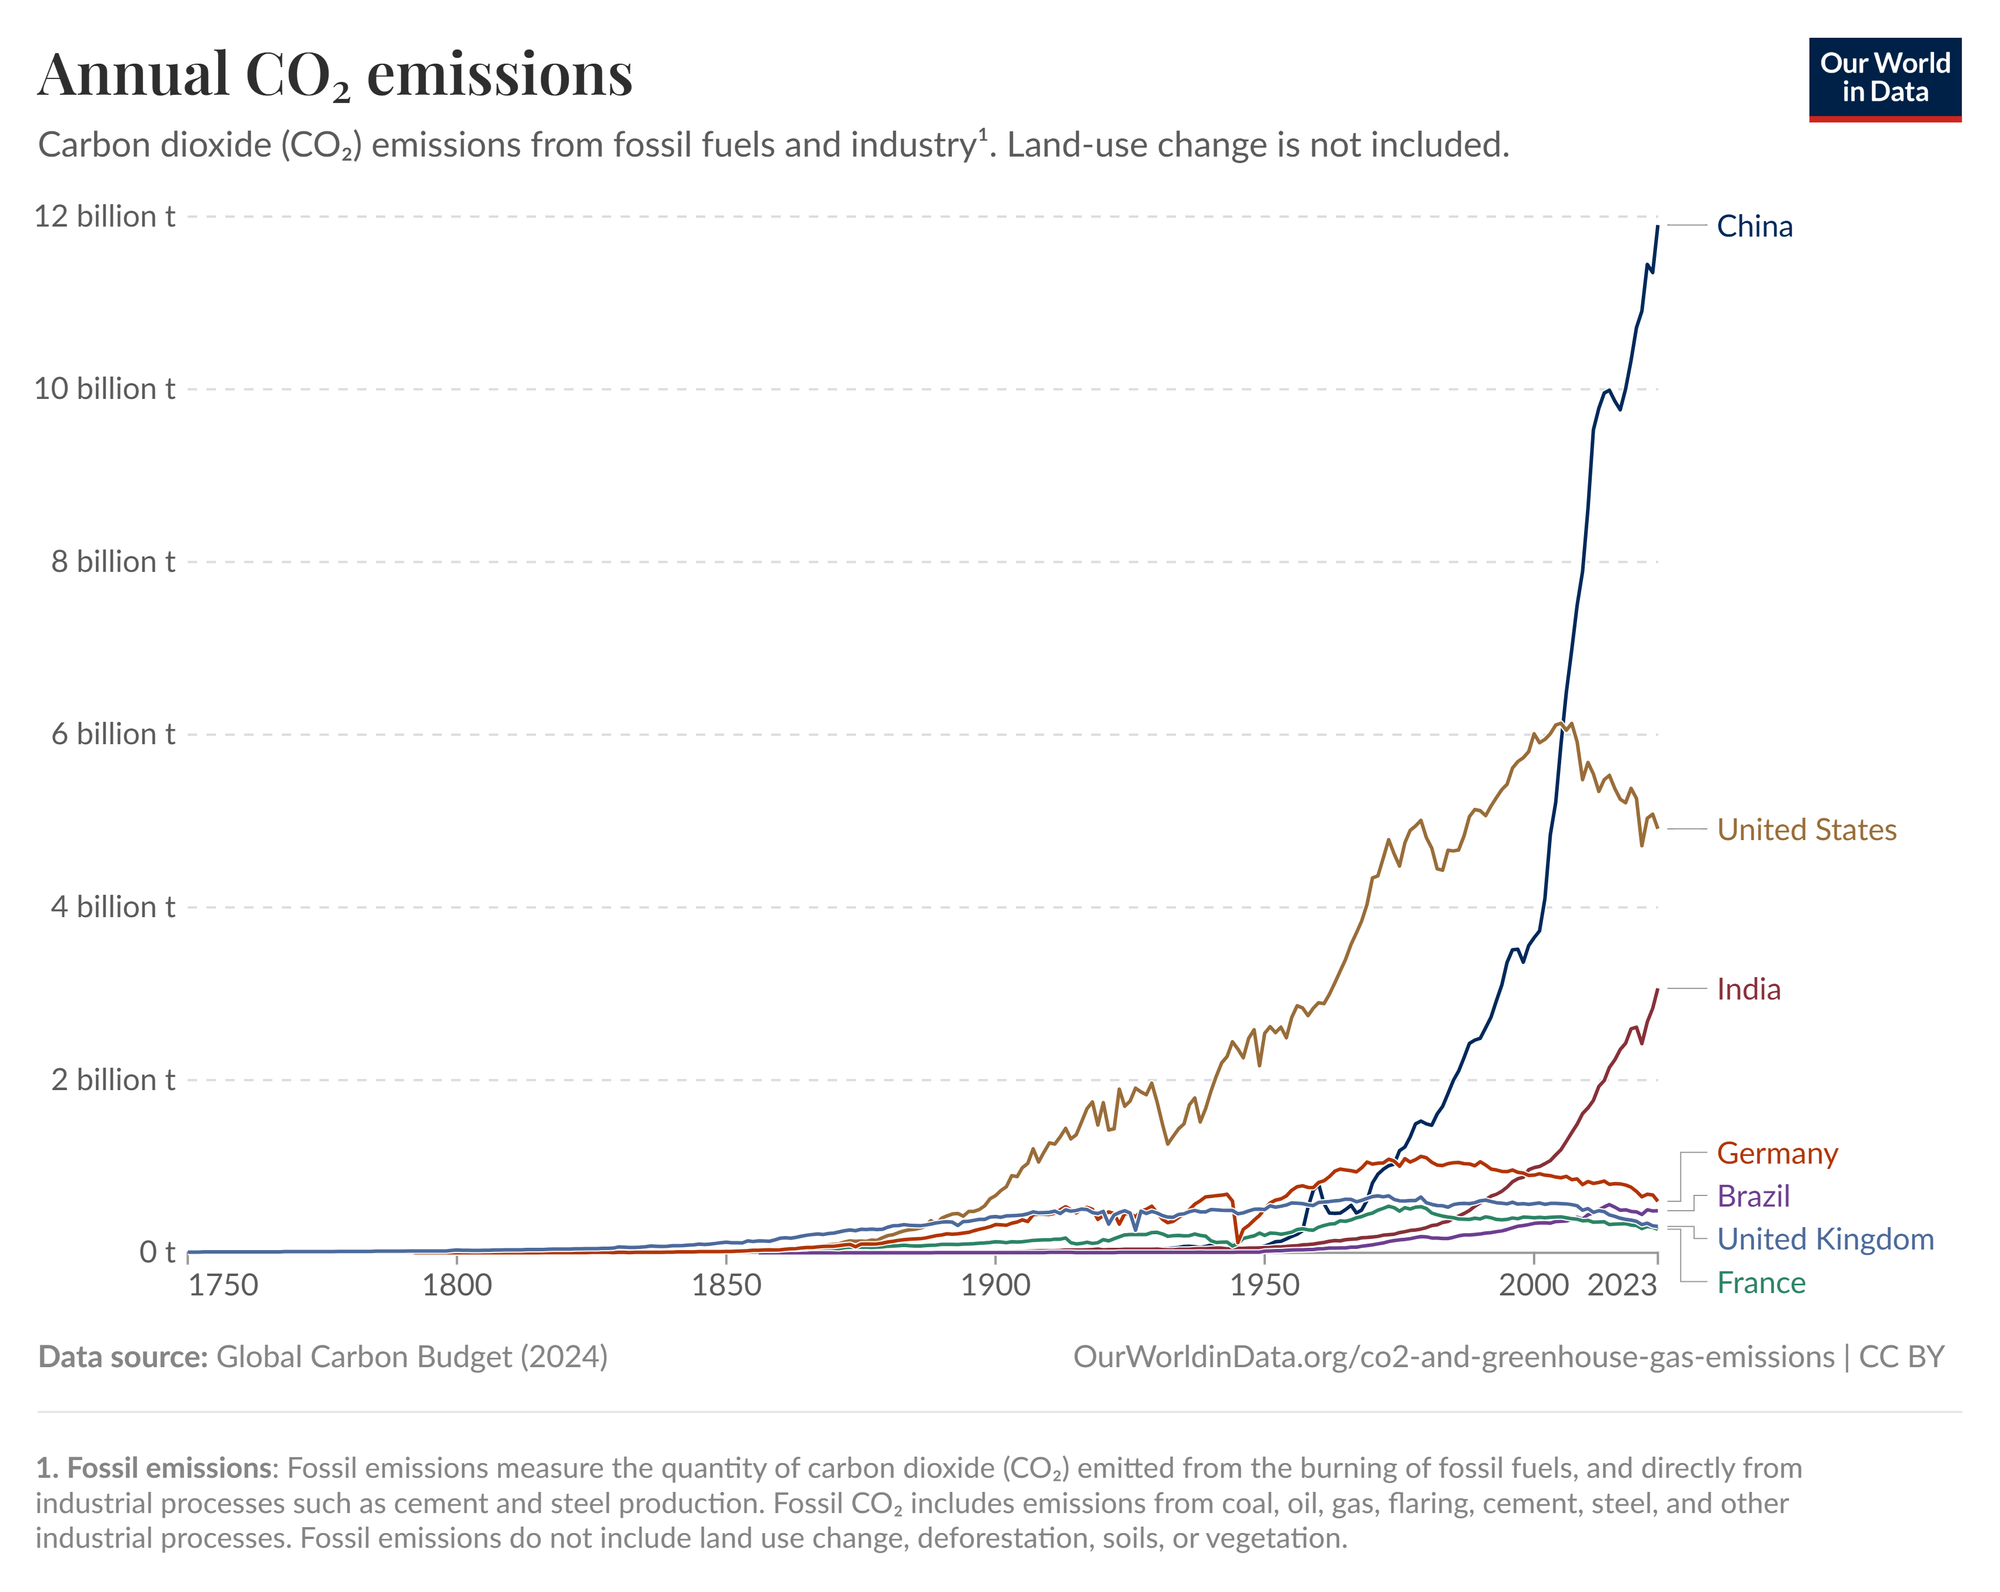
It’s been a decade since the Paris Agreement set the net-zero goal, but emissions have grown from ~55 GtCO2e to ~58 GtCO2e. We're off-track. The EU has made notable progress (down 40% since the 1990s), but global growth—led by developing economies—has outpaced reductions.
Chipping away at our emissions: deep dive into policy
We've established our baseline, and we know where we need to go. Now let's take a look at a few specific policies and how they stack up.
If the Paris Agreement Net Zero target is the end goal, what we'll now evaluate are the milestones along the way.
Policy Example 1: EU's Fit for 55
Launched in July 2021, the Fit for 55 program aims to reduce net1 GHG emissions by at least 55% by 2030 compared to 1990 levels for the EU-27 (i.e., accounting for the 27 member countries of the EU)
- To quantify this:
- The baseline in 1990: EU2 emissions approximated 4,650 MtCO2e (or 4.65 GtCO2e).
- A 55% reduction = 4.65 GtCO2e x 55% = 2.56 GtCO2e
- 2030 target = 4.65 - 2.56 = 2.09 GtCO2e annually
- In 2021, EU emissions were ~3 GtCO2e, already ~40% below 1990 levels
- Still needed: to reach 2.09 GtCO2e, the EU needs to cut another ~0.9 GtCO2e
- As an aside: The EU has been producing less emissions today than it was in the 1990s, but global emissions are still rising.
1 The term net GHG emissions account for the removals from direct air capture, forestry credits, etc.
2 In the 1990s, not all 27 countries were members yet (technically only 12 members), but the baseline reflects the total emissions from the current 27 members.
How much this policy contributes to reductions:
- In the EU context: 5.46% (157 Mt CO2e / 2,875 Mt CO2e)
- In the global context: 0.27% (157 Mt CO2e / 58 000 Mt CO2e)
Policy Example 2: US Heavy Duty Vehicles Phase 3
Finalized by the EPA in March 2024, this policy targets 1 GtCo2e cumulatively by 2055, starting from 2027 from the heavy-duty vehicle emissions3.
- Annualized impact: To reduce 1 GtCO2e from 2027 to 2055, that translates to an average reduction of 35 MtCO2e annually
- 1 GtCO2e = 1000 MtCO2e
- 1000 MtCO2e / 28 years = ~35 MtCO2e / year
How much this policy contributes to reductions:
- In the US context: 0.6% (35 Mt CO2e / 5400 Mt CO2e)
- In the global context: 0.06% (35 Mt CO2e / 58 000 Mt CO2)
3 Heavy-duty vehicles include delivery trucks, buses, and tractor-trailers. In contrast, light-duty vehicles are passenger vehicles (in colloquial terms, 'regular cars') – the clearest distinction in the US is the weight; light-duty vehicles are under 8,500 pounds.
Policy design: Fixed or Relative Targets?
Fixed targets like the one set by the US are oftentimes more straightforward but can become outdated. If US emissions grow due to economic or population growth, the 1GtCO2e will represent a smaller percentage reduction over time.
So where does that leave us?
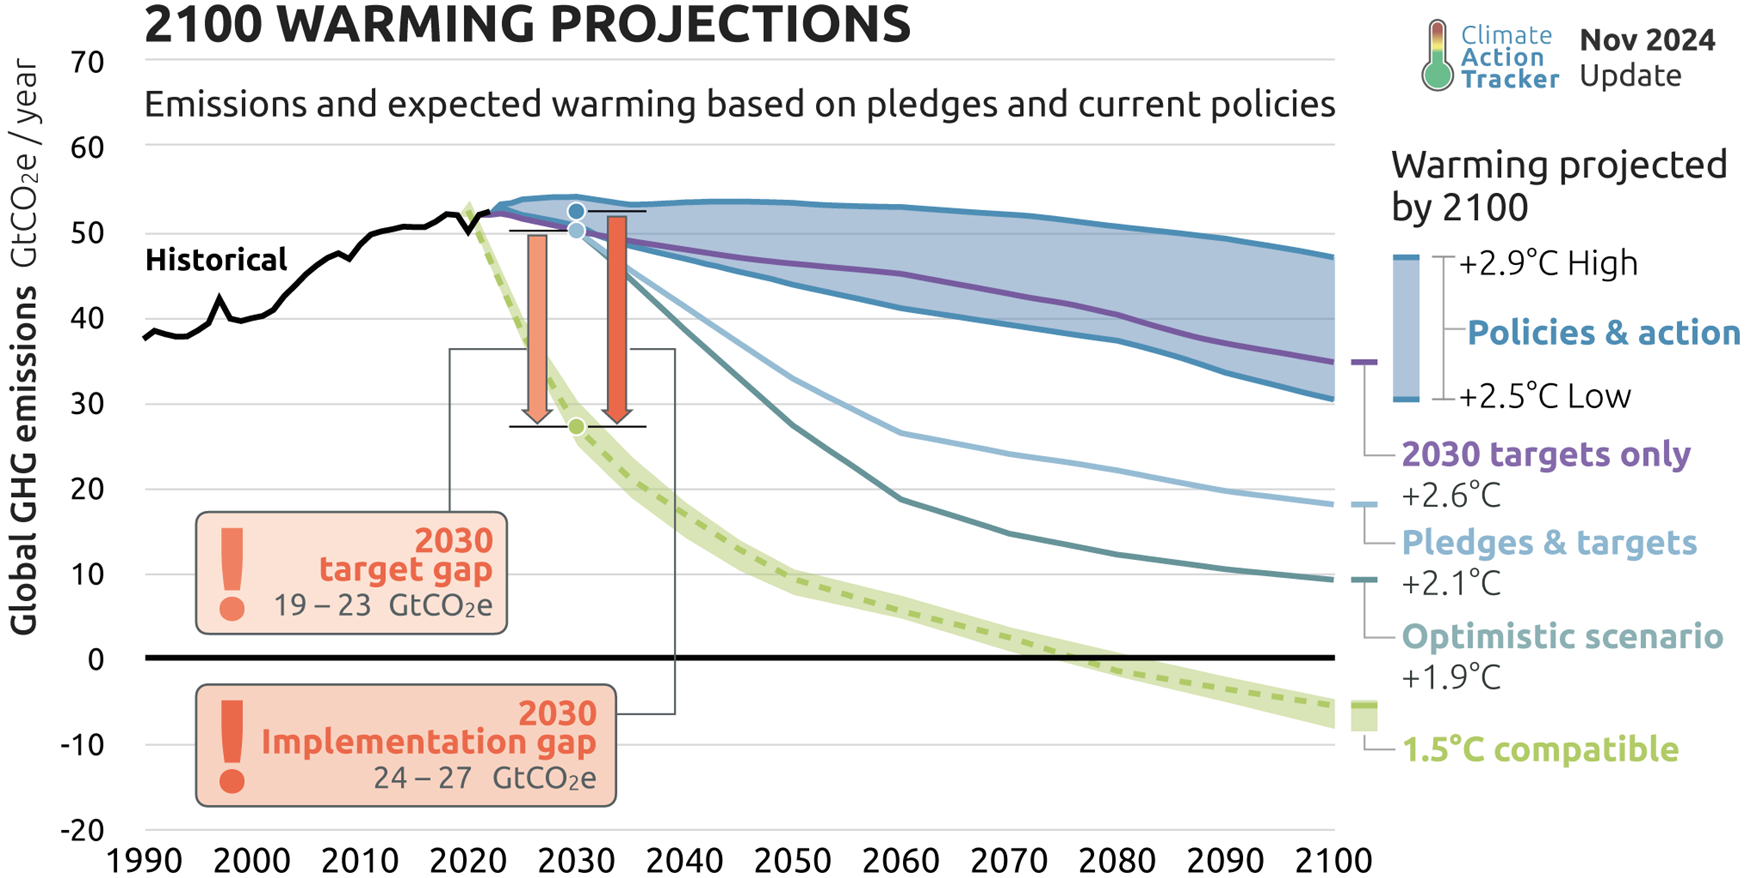
Below is an analysis from Climate Action Tracker that illustrates our GHG emissions trajectories that correspond to temperature pathways. The analysis breaks down different scenarios.
- In the Policies & Action scenario, this reflects current policies (like the two mentioned above) and how we are tracking toward a 2.5-2.9°C temperature increase by 2100.
- Pledges & Targets captures more ambitious long-term goals (e.g., EU for net-zero by 2050) but many are not backed by enforceable policy yet.
Understanding the numbers is key. The numbers show that individual policies are meaningful, but they only chip away at the global total. Policies like the EU Fit for 55 and US heavy-duty vehicle rule are steps in the right direction, but together they account for less than <0.5% of what's needed globally each year.
If we're serious about staying below a 2°C pathway, incremental progress won't cut it. We need broader, faster, and more coordinated efforts to bend the emissions curve.